How do I check my website traffic and visitor analytics?
Understanding how people find and move through your site is the first step to growing it. Edbound AI's Web Analytics gives you a clear, real-time picture of your traffic, audience, and site health in one place, with no third-party tracking code to install. From a single dashboard you can see how many people are visiting, where they come from, what they look at, which devices they use, and how your site is performing and staying secure behind the scenes. This feature helps you understand how your site and content are performing so you can make informed decisions and grow your business.

Web Analytics is only visible to Admins and Co-Admins on your account.
How to access Web Analytics
- Log in to your Edbound AI account.
- Click Web Analytics under Analytics & Operations.
Setting your time range
The Range selector at the top of the dashboard controls the reporting window for every metric and chart on the page. You can choose from the last 6 hours, 12 hours, 24 hours, 3 days, 7 days, 21 days, or 30 days. Shorter ranges (6, 12, and 24 hours) plot your data in hourly intervals, while longer ranges plot it daily. All timestamps are displayed in UTC.
The summary cards
The five cards at the top of the dashboard give you headline totals for the time range you have selected.
Click any card to load its trend chart on the right, so you can see how that metric has moved over time.
- Requests - The total number of calls made to your site, meaning every individual request for a page, image, script, file, or API response. It includes bots and automated traffic, so it is always higher than your visitor count.
- Data Transfer - The combined size of everything your site sent out to load what visitors requested, such as pages, images, videos, scripts, and files. Shown in MB, it reflects how heavy your traffic was rather than how many people visited.
- Visits - The number of sessions from real visitors, meaning actual people landing on and browsing your site. This is much lower than Requests because a single visit triggers many requests behind the scenes.
- Cached - The percentage of requests served from a saved copy on the network instead of being fetched fresh from your server. A higher percentage means faster load times for visitors and less load on your site.
- Threats Blocked - The number of malicious or suspicious requests the firewall stopped before they reached your site, such as bot attacks or hacking attempts.
Requests Volume by Country
This section maps where your traffic is coming from around the world.
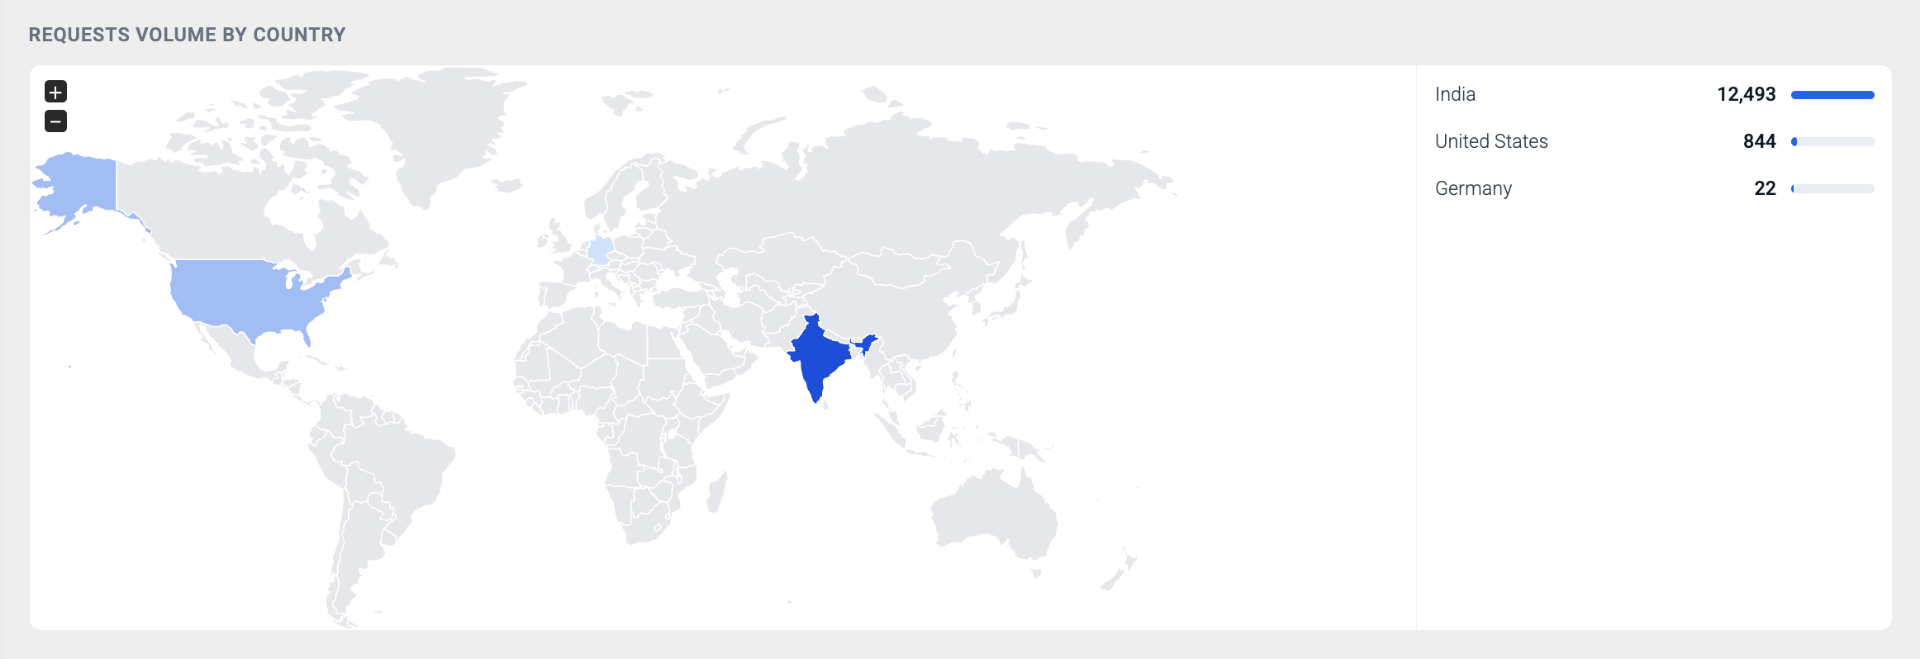
Hover over any country on the map to see its request volume, and use the ranked list beside the map to view your top countries by request count. This helps you understand which regions your audience is in so you can tailor your content and campaigns accordingly.
Requests Volume by Source
These panels break your traffic down across several dimensions, giving you a detailed view of who is reaching your site and how.
Each panel ranks its entries by request volume.
- Referers - Lists the sites that sent traffic to you. "None (direct)" means the visitor typed your URL directly or used a bookmark.
- Paths - Ranks the most requested URLs and pages on your site, so you can see what your audience is looking at most.
- Hosts - Identifies the domains serving your traffic.
- Source browsers - Breaks down the browsers and bots making requests, such as Chrome, Safari, and GoogleBot.
- Source device types - Splits your traffic between desktop and mobile, helping you confirm your site is optimized for how people actually visit.
- Edge status codes - Reports the HTTP response codes returned, such as 200 (success), 304 (served from cache), and 404 (not found).
- Data centers - Maps the edge locations that served your requests, listed as airport codes such as MAA (Chennai), BLR (Bengaluru), and DEL (Delhi).
- Source ASNs - Reveals the networks and internet providers your visitors connect through, such as Airtel, Tata, or Amazon.
- Source IPs - Highlights the top individual IP addresses making requests.
- HTTP versions - Indicates the protocol versions used, such as HTTP/2 and HTTP/1.1.
- Content types - Categorizes the file types served, such as html, json, css, and images.
- Request methods - Distinguishes the request types, such as GET (load a page) and POST (submit data).
- Cache statuses - Tracks how each request was served, such as hit (from cache), miss (from origin), and dynamic.
- Threats (firewall) - Flags any blocked malicious requests, and displays "No data" when none are detected.
What is the difference between Web Analytics and Google Analytics?
Both tools measure your site, but they answer different questions. Web Analytics is built into Edbound AI and needs no setup. It measures every request at the network edge, including bots, API calls, security threats, and cache performance, which makes it the right place to look for traffic, performance, and security insights. Google Analytics needs setup and a measurement ID, and it focuses on visitor behavior, marketing events, and conversions such as Page View, Begin Checkout, and Purchase. Many creators run both: Web Analytics for site traffic and health, and Google Analytics for marketing and conversion tracking.
What is the difference between Visits and Requests?
These two metrics count different things, and the gap between them is normal. A Visit is a session from a real visitor. A Request is any single call to your site, including images, scripts, API calls, and bot activity. Because one visit creates many requests, your Requests number will always be much higher than your Visits number.
Why do I see bots like GoogleBot in my analytics?
Bots are a normal part of web traffic. Search engines such as Google crawl your site to index it, which supports your search rankings. This bot activity appears under Source browsers and is counted in Requests, not in Visits, so it does not inflate your visitor numbers.
Why is my Threats Blocked count zero?
A zero count is a good sign. It means the firewall detected no malicious requests during the selected time range. When threats are present, they appear in the Threats (firewall) panel so you can review them.
Important Considerations
- All timestamps and dates in Web Analytics are displayed in UTC.
- Web Analytics measures traffic to your hosted Edbound AI site and pages.
- Web Analytics is a read-only dashboard for viewing your traffic and site health.
- If you do not see Web Analytics in your account, raise a ticket with support.
Related Articles
How to check which emails have been sent to a user?
Knowing exactly which emails have been sent to your users—and how they interacted with them—helps improve communication, boost engagement, and reduce email fatigue. This guide shows how to check a user's email history and understand the effectiveness ...How to check the status of your data export requests and download exported data?
You can easily track and download your data export requests from your Knorish dashboard. The data export page provides details of all your export activities, including export type, request date, expiry date, and current status. To check and download ...Check which site pages have been indexed by Google Search Engine
This article shows you how to check and act upon old indexed URLs that you wish to remove from the search index. To check which pages have been indexed for your site, do a google search and check all the pages listed one by one. On Google Search, ...How to enable multiple languages on the Knorish website using Google Translate?
Easily enable multiple languages on your Knorish website by integrating Google Translation. This feature allows visitors to select their preferred language, and Google Translate will automatically convert the page for them. What will be displayed on ...How to check the performance of your WhatsApp broadcasts and messages, troubleshoot message delivery failures, and improve deliverability?
Monitoring the performance of your WhatsApp broadcasts is essential to understanding message delivery, user engagement, and overall campaign effectiveness. Knorish makes it easy to track key metrics like delivery, failures, and read rates for each ...